Foreign Investment & Trade
Colorado’s economy connects to the world
Global commerce drives Colorado’s economy
Foreign investment is a major factor in Colorado’s growing economy, creating jobs and driving trade. Customers in every country world-wide now buy goods and services from Colorado.

733,900
Colorado jobs supported by trade
(WTC Denver)
800+
Global employers in Colorado
(Global Business Alliance)
35.1%
5-year employment growth from FDI In Colorado
(Global Business Alliance)
$8.1
Billion Colorado exports in 2019
(State of Colorado)
Growth
Export strength
Exports from companies in the Metro area have remained strong with a 4.7% compound annual growth rate over five years.
2020 Top exports
Manufacturing and tech dominate the top 10 export categories coming from the Metro area.
| Computer & Electronic Products | 29.3% |
| Food & Kindred Products | 18.4% |
| Machinery, Except Electrical | 10.7% |
| Transportation Equipment | 8.6% |
| Chemicals | 6.8% |
| Miscellaneous Manufactured Commodities | 5.7% |
| Fabricated Metal Products, Nesoi | 4.7% |
| Plastics & Rubber Products | 2.7% |
| Electrical Equipment, Appliances & Components | 2.5% |
| Nonmetallic Mineral Products | 1.8% |
| U.S. Department of Commerce, International Trade Administration, 2018 |
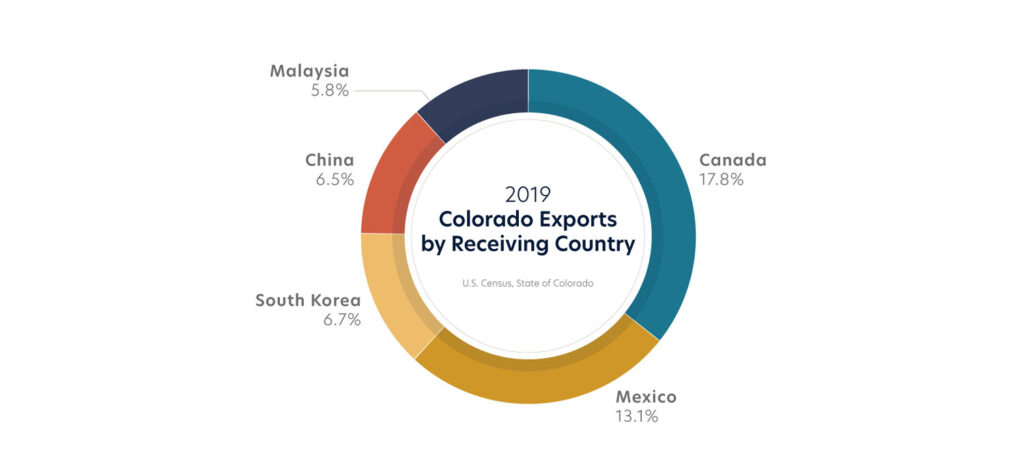
Exports
Top trade countries
Which countries top the list for goods and services exported to from Colorado? Canada and Mexico, followed by South Korea, China, and Malaysia.

Trade
Foreign trade zone advantage
The City of Aurora is part of Foreign Trade Zone 293, strategically located to provide a central location between the coasts for businesses looking to meet increasing trade demands. Companies in a FTZ may have certain tariffs on imported parts, supplies, and exported products deferred, reduced, or eliminated.